Scan analytics
See how many people scan, when, where and on what device
The overview
Analytics in the top menu shows every code together: total scans, unique visitors, the top country and the top device, a scan trend and your best performing codes. Choose a time range (the last 7, 30 or 90 days, the last year, or your own dates) and filter by group to compare campaigns.

Your best performing codes
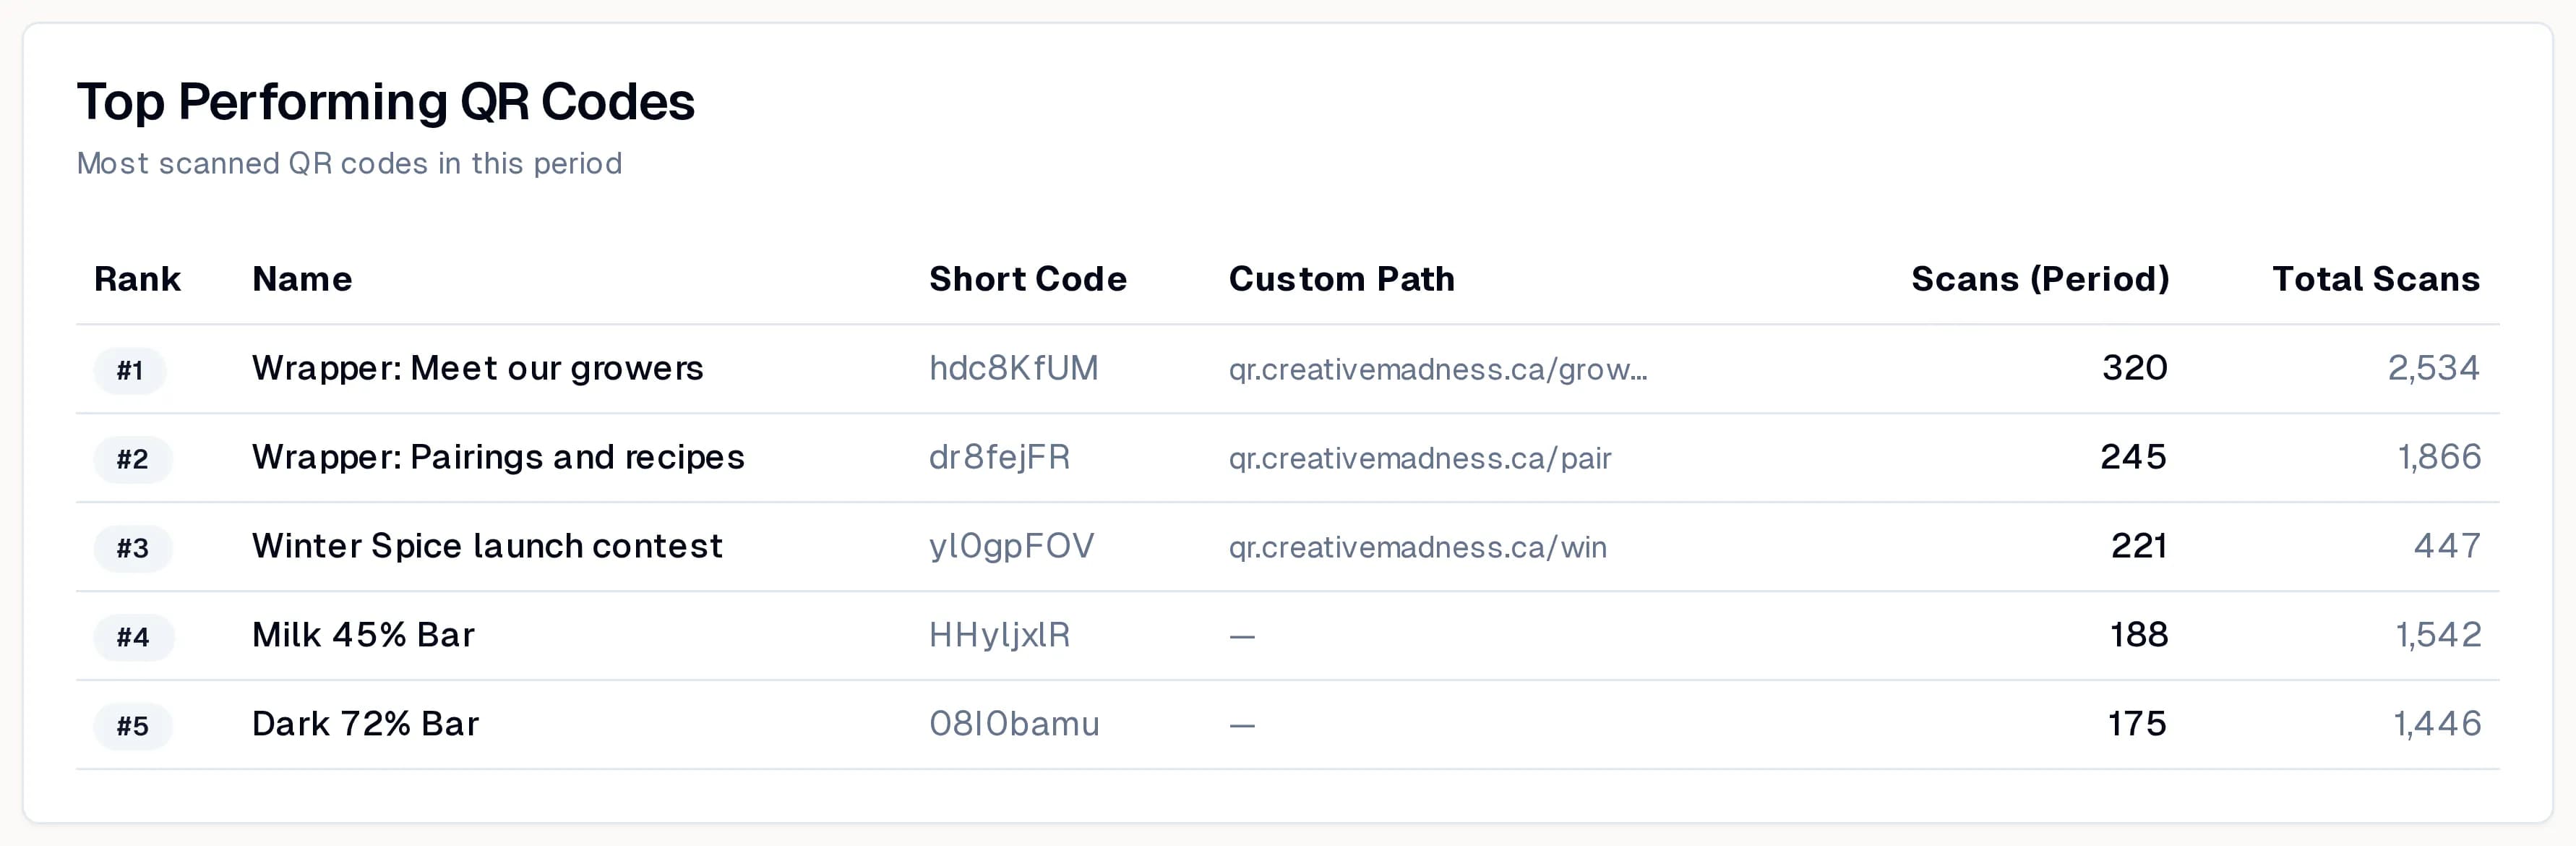
The list under the charts ranks codes by scans in the period, next to their total since they were created. It is a quick way to see which wrapper, poster or insert is pulling its weight.
One code in detail
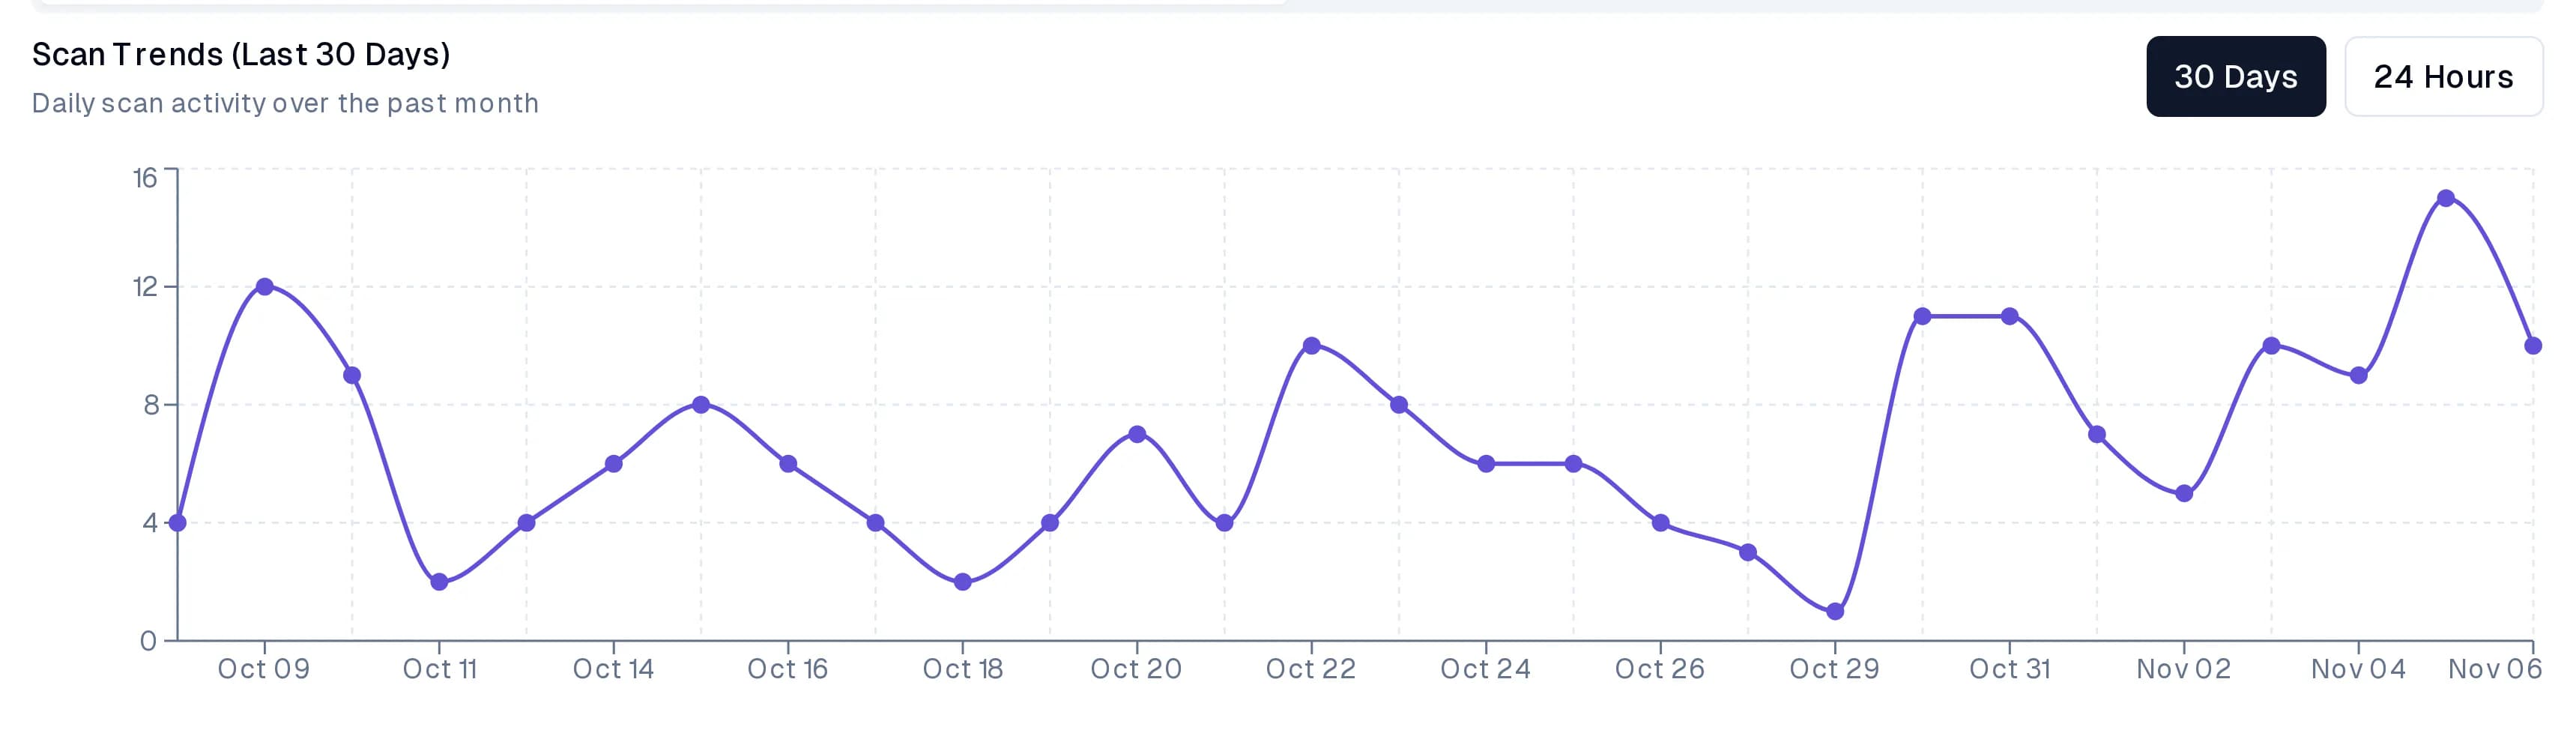
Open any code's scan counter, or pick it from the list, to see its own analytics. Basic Analytics has the daily trend and an activity heatmap. Advanced adds devices, browsers, operating systems, countries and cities, and the share of returning visitors.
When people scan
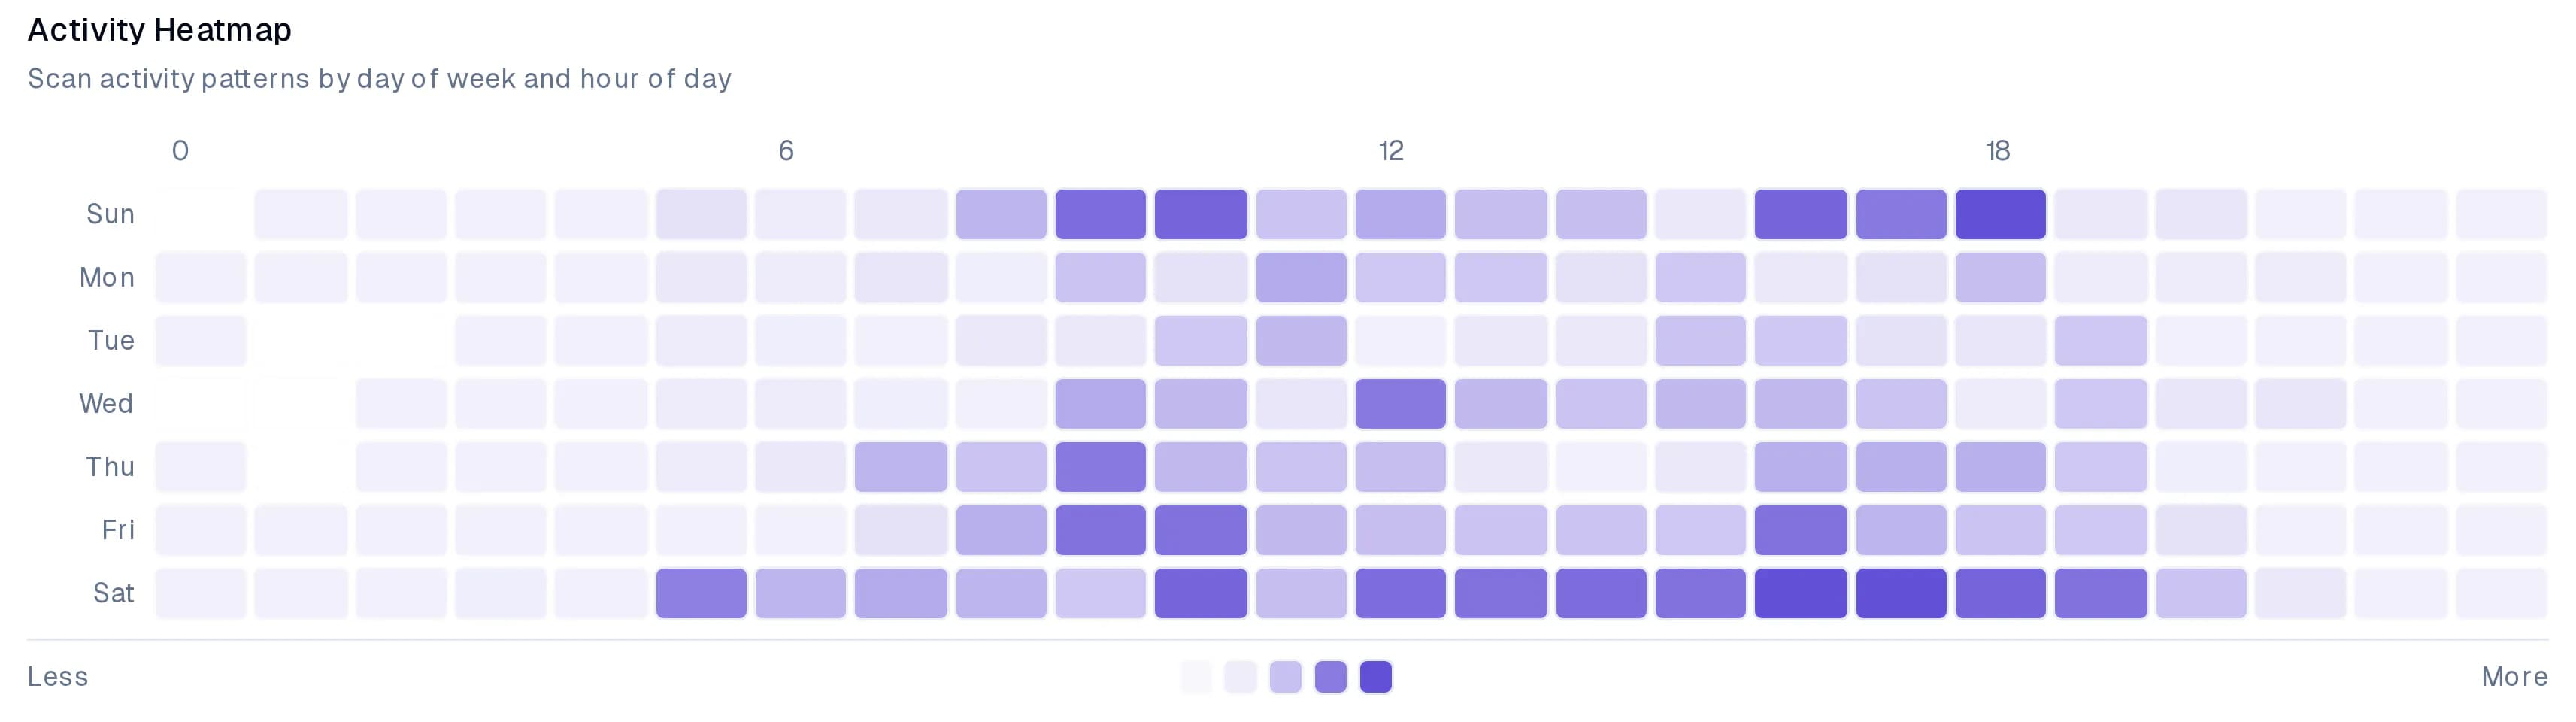
The activity heatmap shows scans by day of the week and hour of the day. Use it to time a social post, staff a booth or decide when an in-store display matters most.
Devices and countries
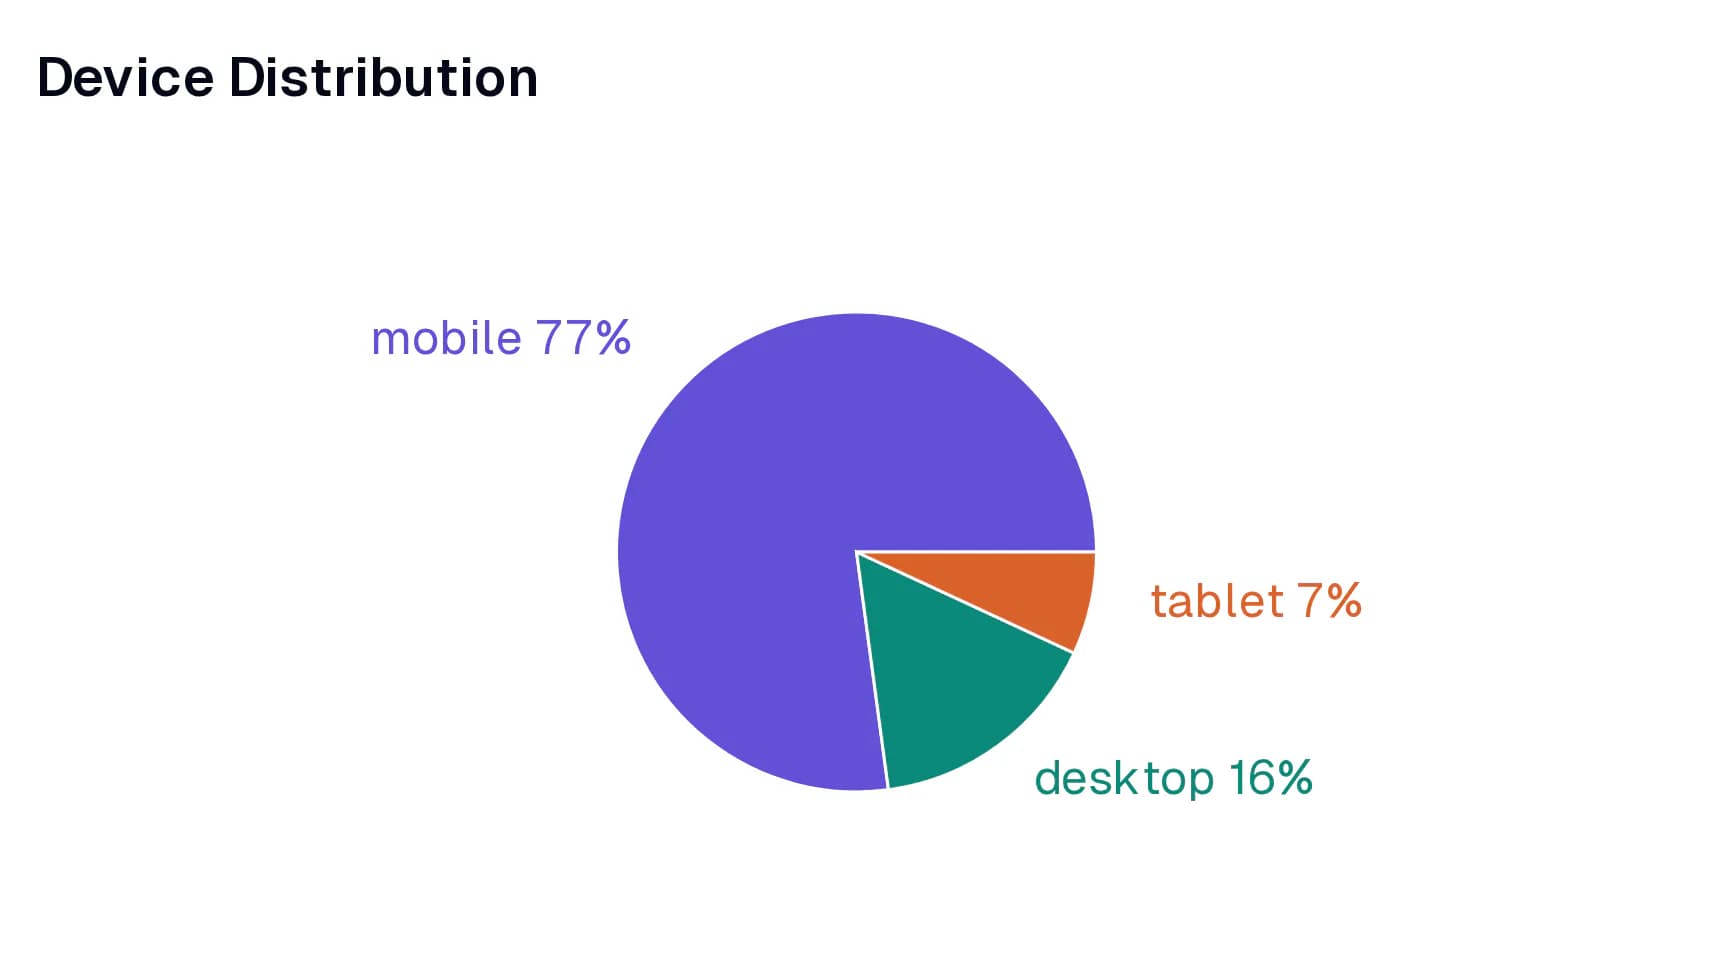
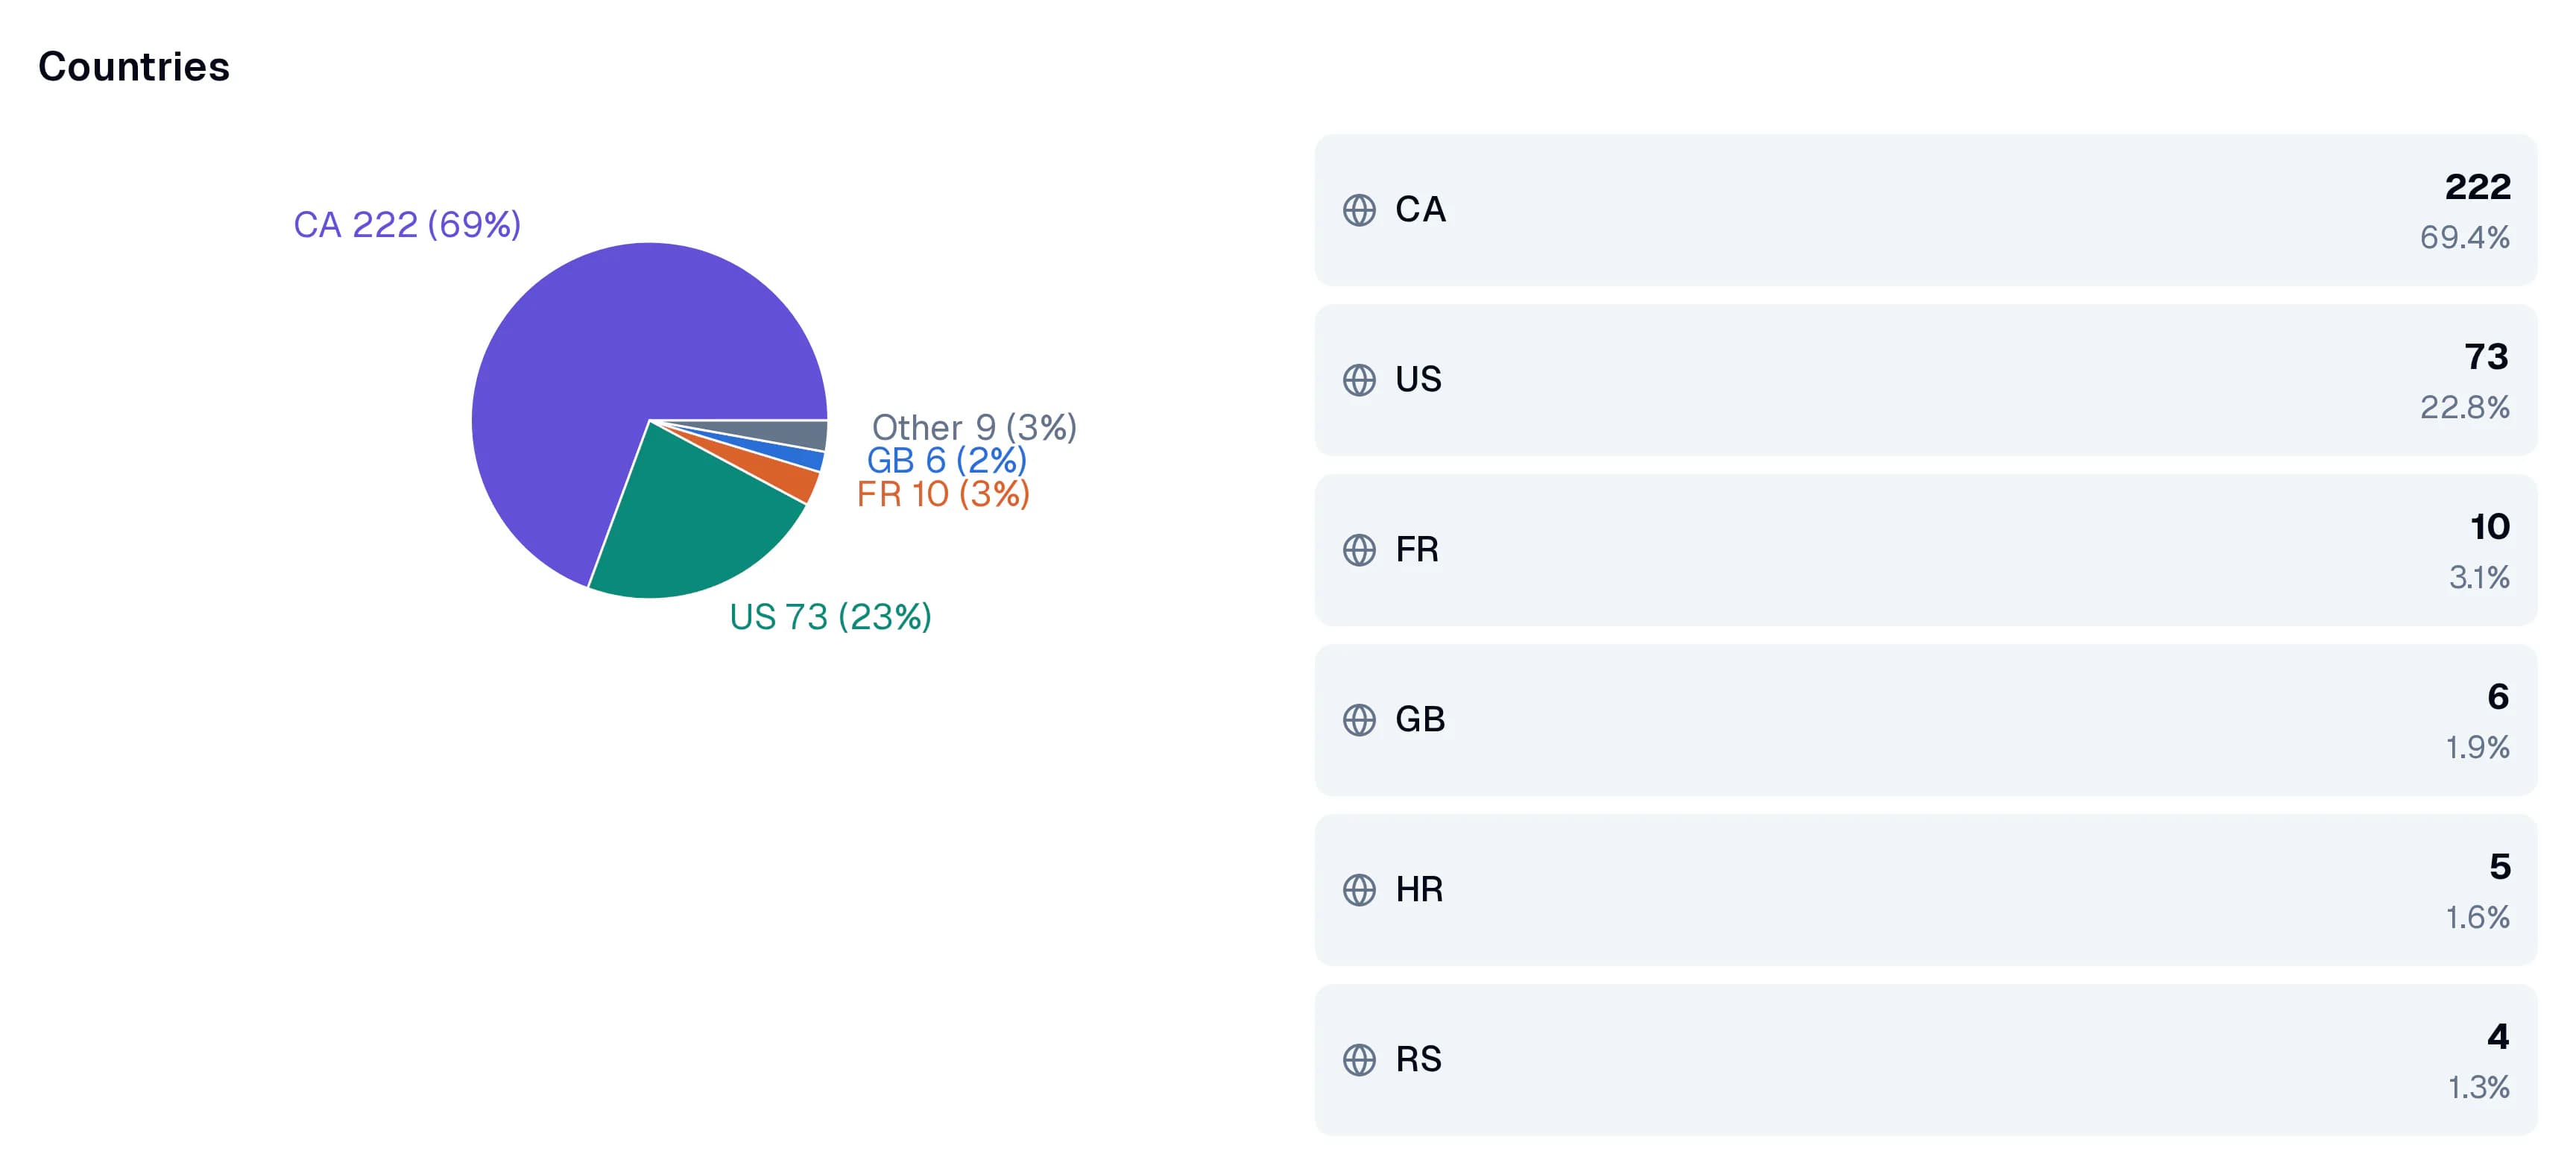
Most scans come from phones, but the split tells you whether people also open your links on a computer later. The country and city lists show where your packaging travels.
Export
Use CSV or Excel on the overview or on a single code to take the numbers into your own reports.